Medicare spending and low-value care: Lessons from the Dartmouth Atlas and Lown Hospitals Index
For more than 20 years, the Dartmouth Atlas project has published data on Medicare spending across the country, highlighting outliers of high-spending and low-spending regions. This research, originally spearheaded by Dr. Jack Wennberg, was among the first to identify the extreme regional variation in the number of certain procedures performed, such as hysterectomy and tonsillectomy. More recently, the Atlas has published reports on variation in neonatal intensive care, end-of-life care, and many other topics.
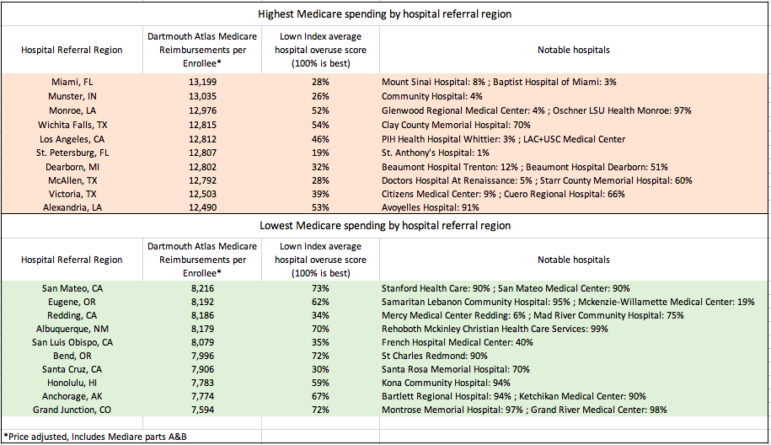
But despite the increased attention being given to regional variation in health care spending, there has been surprisingly little change in the regions spending the most and the least over the past ten years, the latest edition of Atlas data shows. As Tara Bannow writes in Modern Healthcare, some of the same hospital referral regions that topped the list of Medicare spending in 2010–such as Miami, FL, Munster, IN, and Monroe, LA–were still at the top in 2017. And regions that spent much less than average in 2010 such as Grand Junction, CO, Anchorage, AK, and Honolulu, HI still had very low spending comparatively in 2017.
Medicare spending and low-value care
To what extent does high Medicare spending reflect more hospital utilization of low-value care? And can low-value care within certain regions be attributed to individual hospitals? We took a look at the highest and lowest spenders by hospital referral region and compared them to Lown Hospitals Index overuse scores for hospitals in those regions, to gain insight into these questions.
We found considerable overlap between Medicare spending and Lown Hospitals Index overuse scores (see Table below). Out of the 10 regions with the highest per-patient Medicare spending, six had below-average scores for avoiding overuse (taking an average of all of the overuse scores of the hospitals in that region), and none were in a percentile above 54 (higher is better at avoiding overuse). Among the 10 and regions with the lowest Medicare spending, seven were in the 59th percentile or higher for avoiding overuse.
The similarities between high-overuse regions and high-spending regions make sense. Kristen Bronner, the Atlas’ managing editor, estimated that two-thirds of differences in spending are driven by utilization (the other third is driven by price). “A lot of the regional differences come down to available supply in an area,” said Bronner in Modern Healthcare. “If there are a lot of hospital beds or physicians in an area, that supply will get used, which is a big part of what drives higher Medicare spending,” she said. Bronner’s theory holds up when looking at the Lown Index scores, because many of the hospitals in low-spending regions did not have the capacity to overuse (e.g. they did not have a cardiac catheterization lab to put in stents).
However, there were several exceptions to the rule. For example, Wichita Falls, TX has the fourth-highest reimbursements per patient across the country, but the hospitals in this region have better-than-average rankings on the Lown Hospitals Index for avoiding overuse. Similarly, there are a few hospitals that scored poorly on avoiding overuse, but still had very low spending (see Table above for examples).
What’s behind these discrepancies? The Lown Hospitals Index measures 13 common low-value services, but there are many many more examples of low-value care in hospitals that are not included on the index. Also, not all low-value services cost the same. There may be hospitals that score poorly on the index because they overuse certain services, but these services are not as expensive as others, so their overall spending remains low. Also, the Lown Index does not measure hospitals’ use of proton beam therapy, which is extremely expensive and often overused (Miami has two proton beam machines).
Comparing the Dartmouth Atlas and the Lown Index also shows that there is still variation even within hospital referral regions. Although certain regions had hospitals that all scored poorly (St. Petersburg, FL, for example) or well (like Bend, OR) on avoiding overuse, other regions had some high-performing and some low-performing hospitals. For example, Eugene OR has a hospital in the 95th percentile for avoiding overuse, but also a hospital in the bottom 20 percent.
One silver lining from the Dartmouth Atlas data is that overall spending growth per Medicare beneficiary has slowed down considerably from the 2000s to the 2010s. Looking at Medicare data from two sides– spending and overuse– can be useful for hospitals to track their use of low-value care, and may help hold individual hospitals accountable for waste and harm.