Covid Curve Tracker: March 30, 2020
These are historical results. For the most recent results, visit the COVID-19 Curve Tracker.
U.S. States
New York
1800
Peak Deaths per Day
April 15
Date of Peak Deaths
39,000
Total Deaths
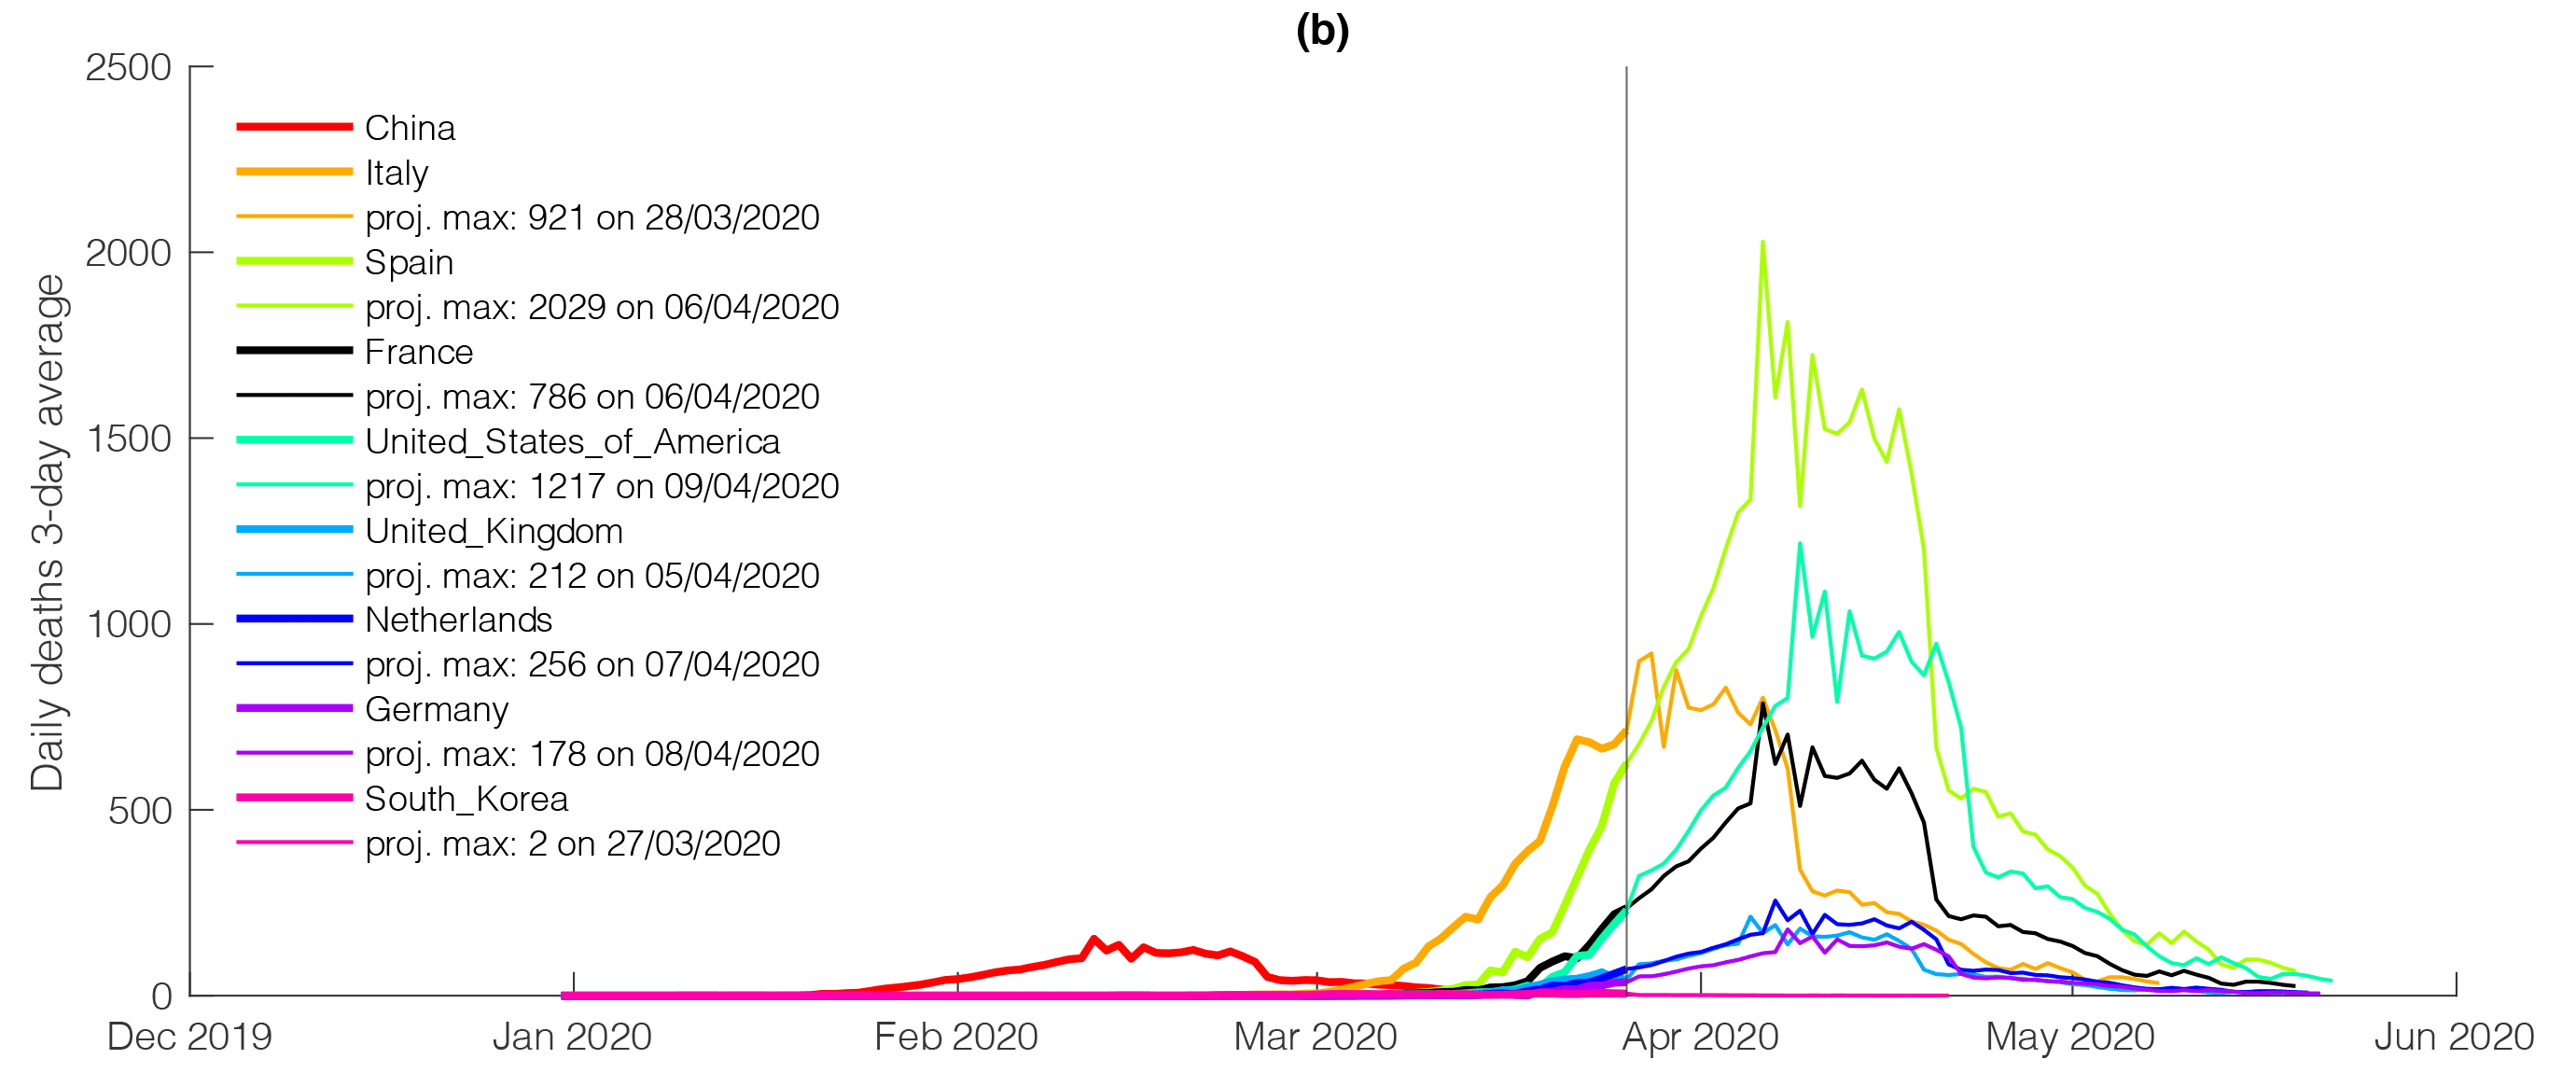
Countries
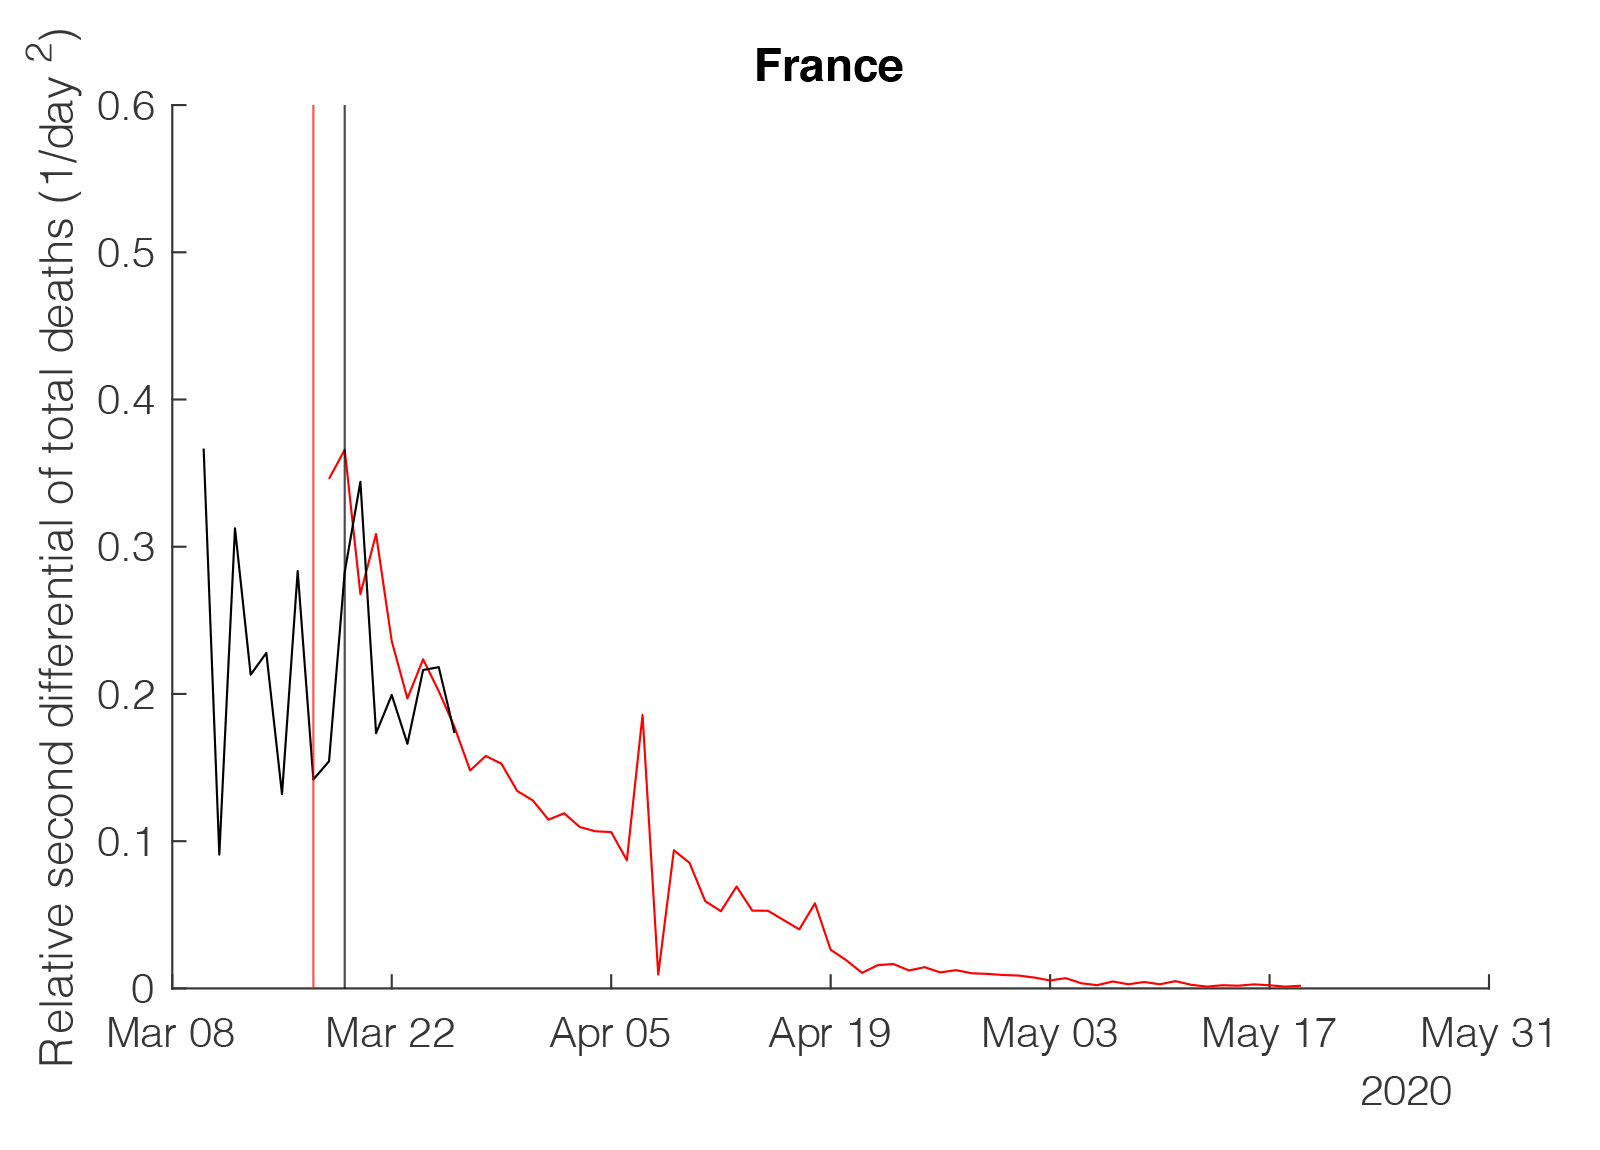
France
710
Peak Deaths per Day
April 5
Date of Peak Deaths
15,000
Total Deaths
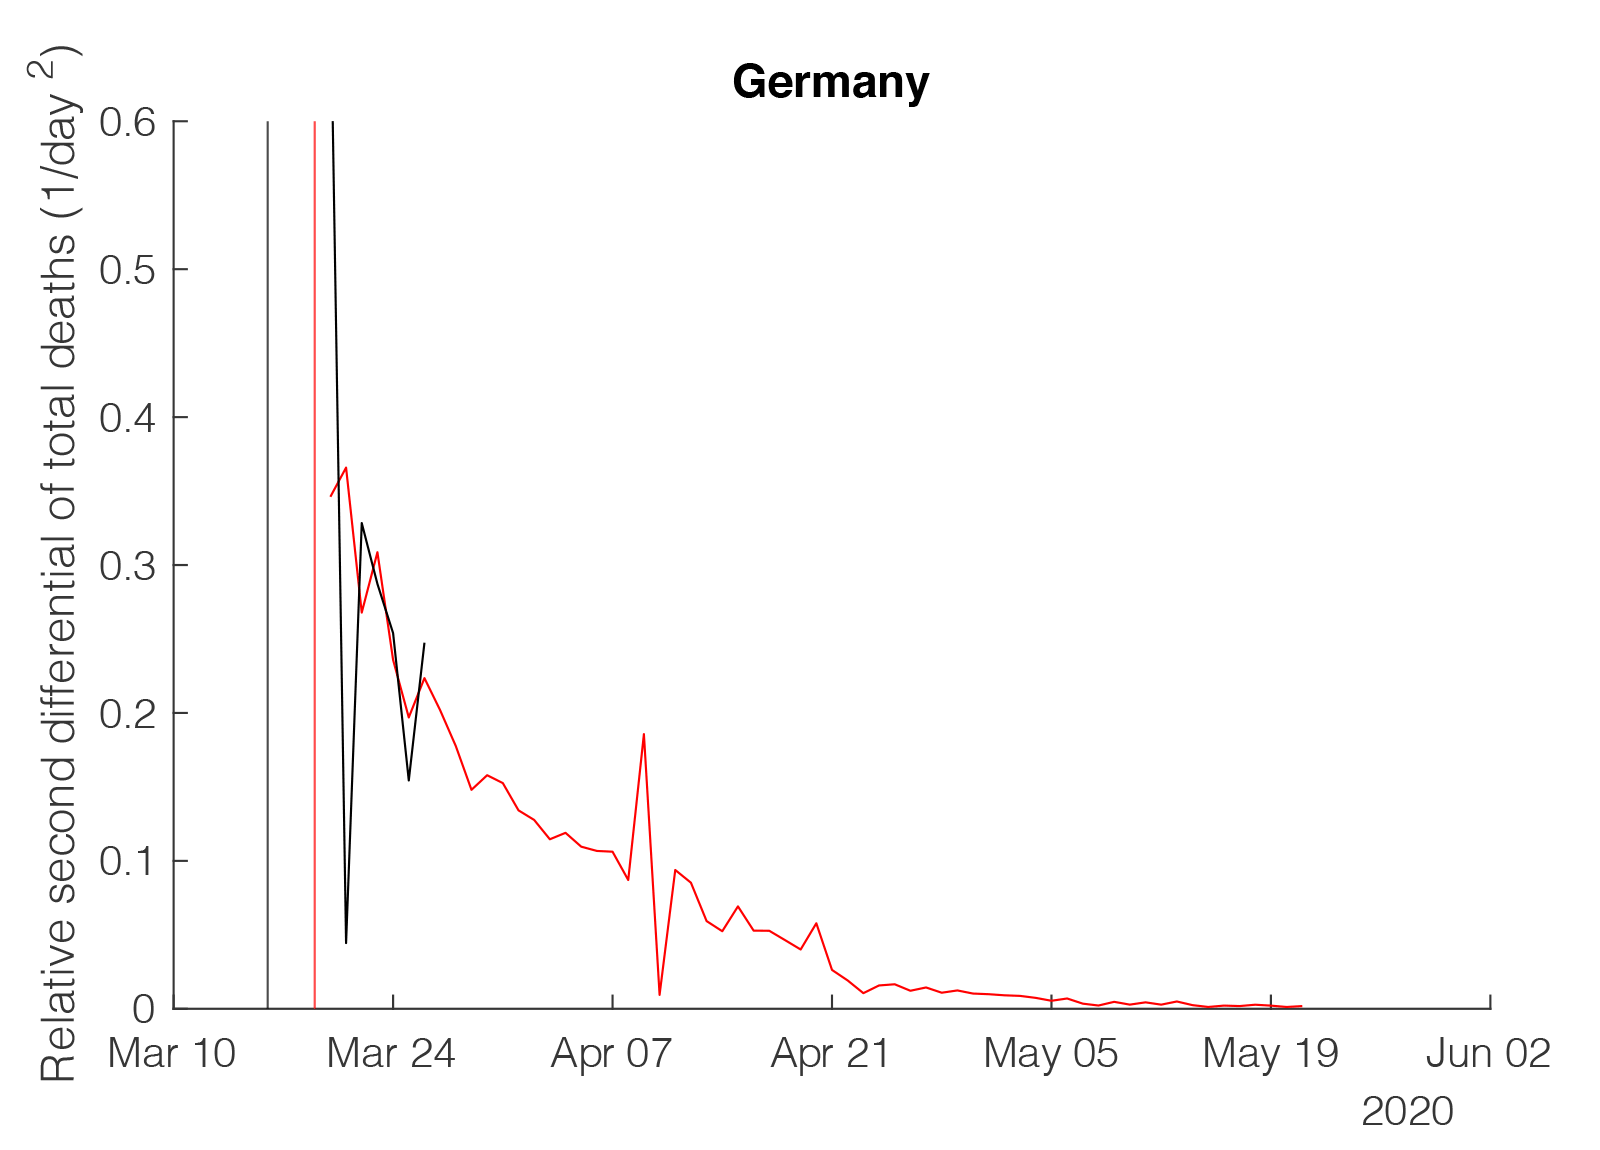
Germany
190
Peak Deaths per Day
April 8
Date of Peak Deaths
4,200
Total Deaths
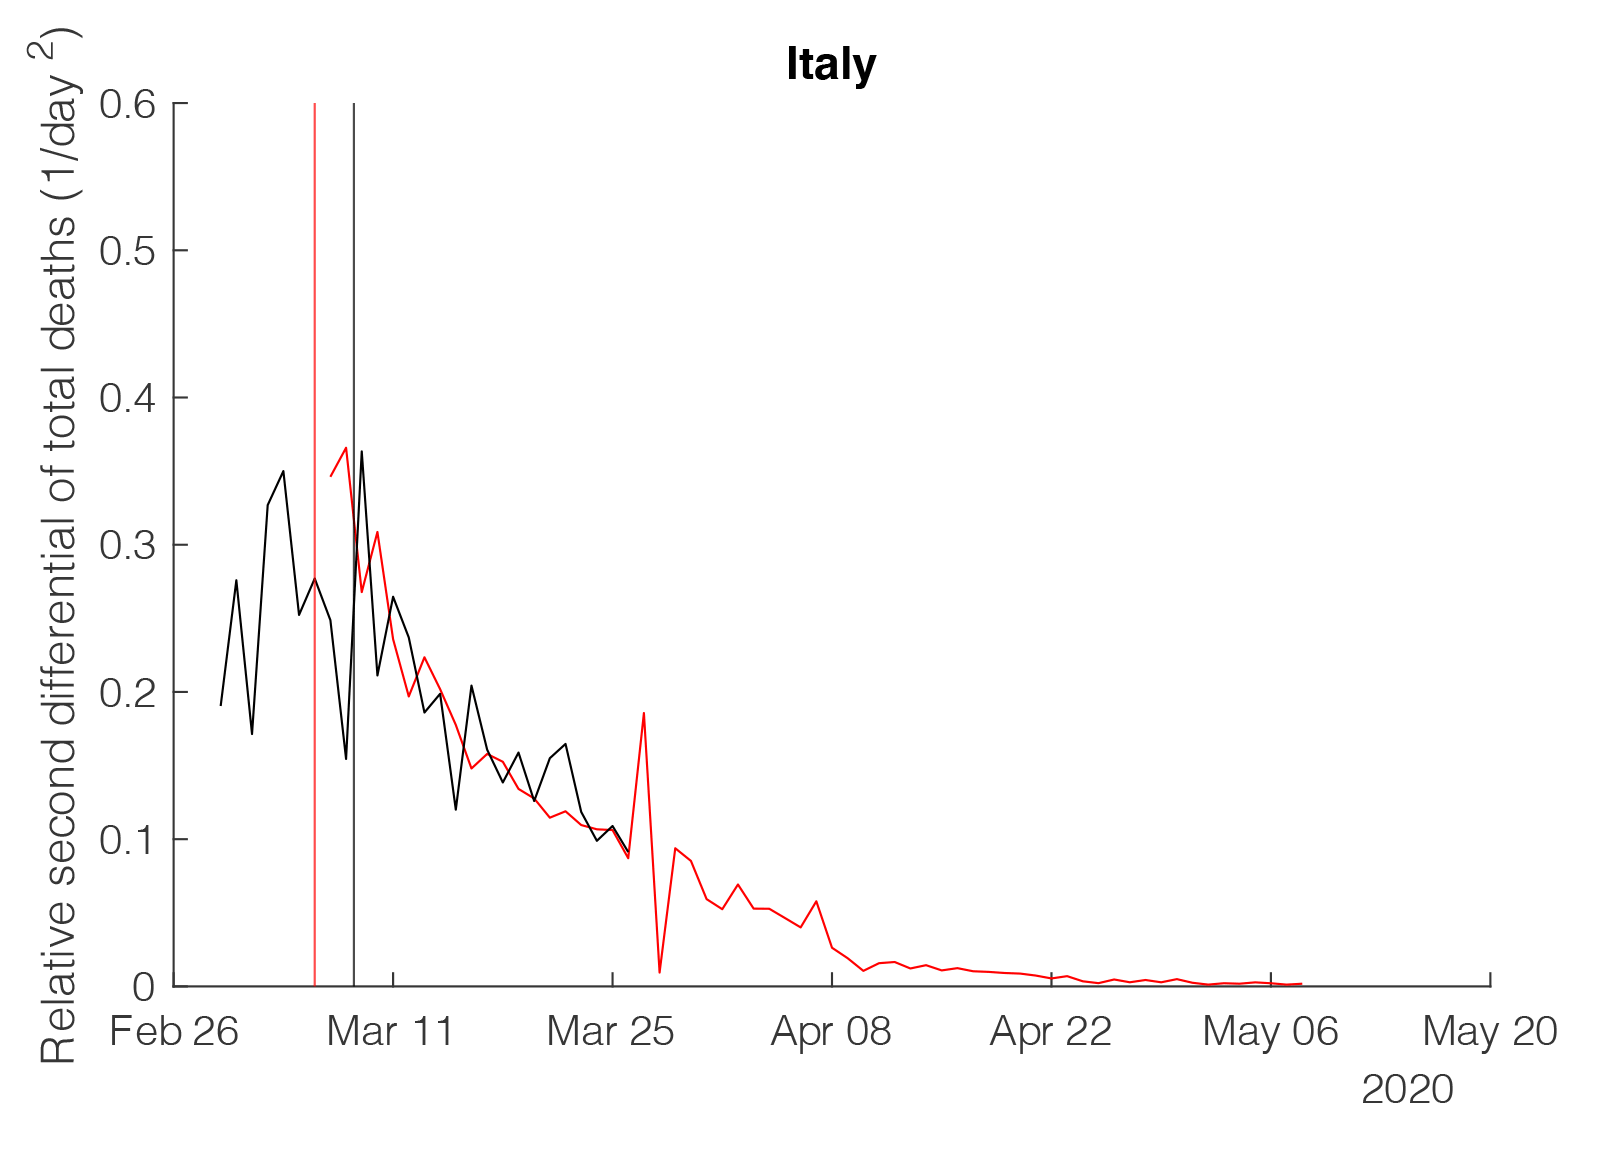
Italy
800
Peak Deaths per Day
April 3
Date of Peak Deaths
21,000
Total Deaths
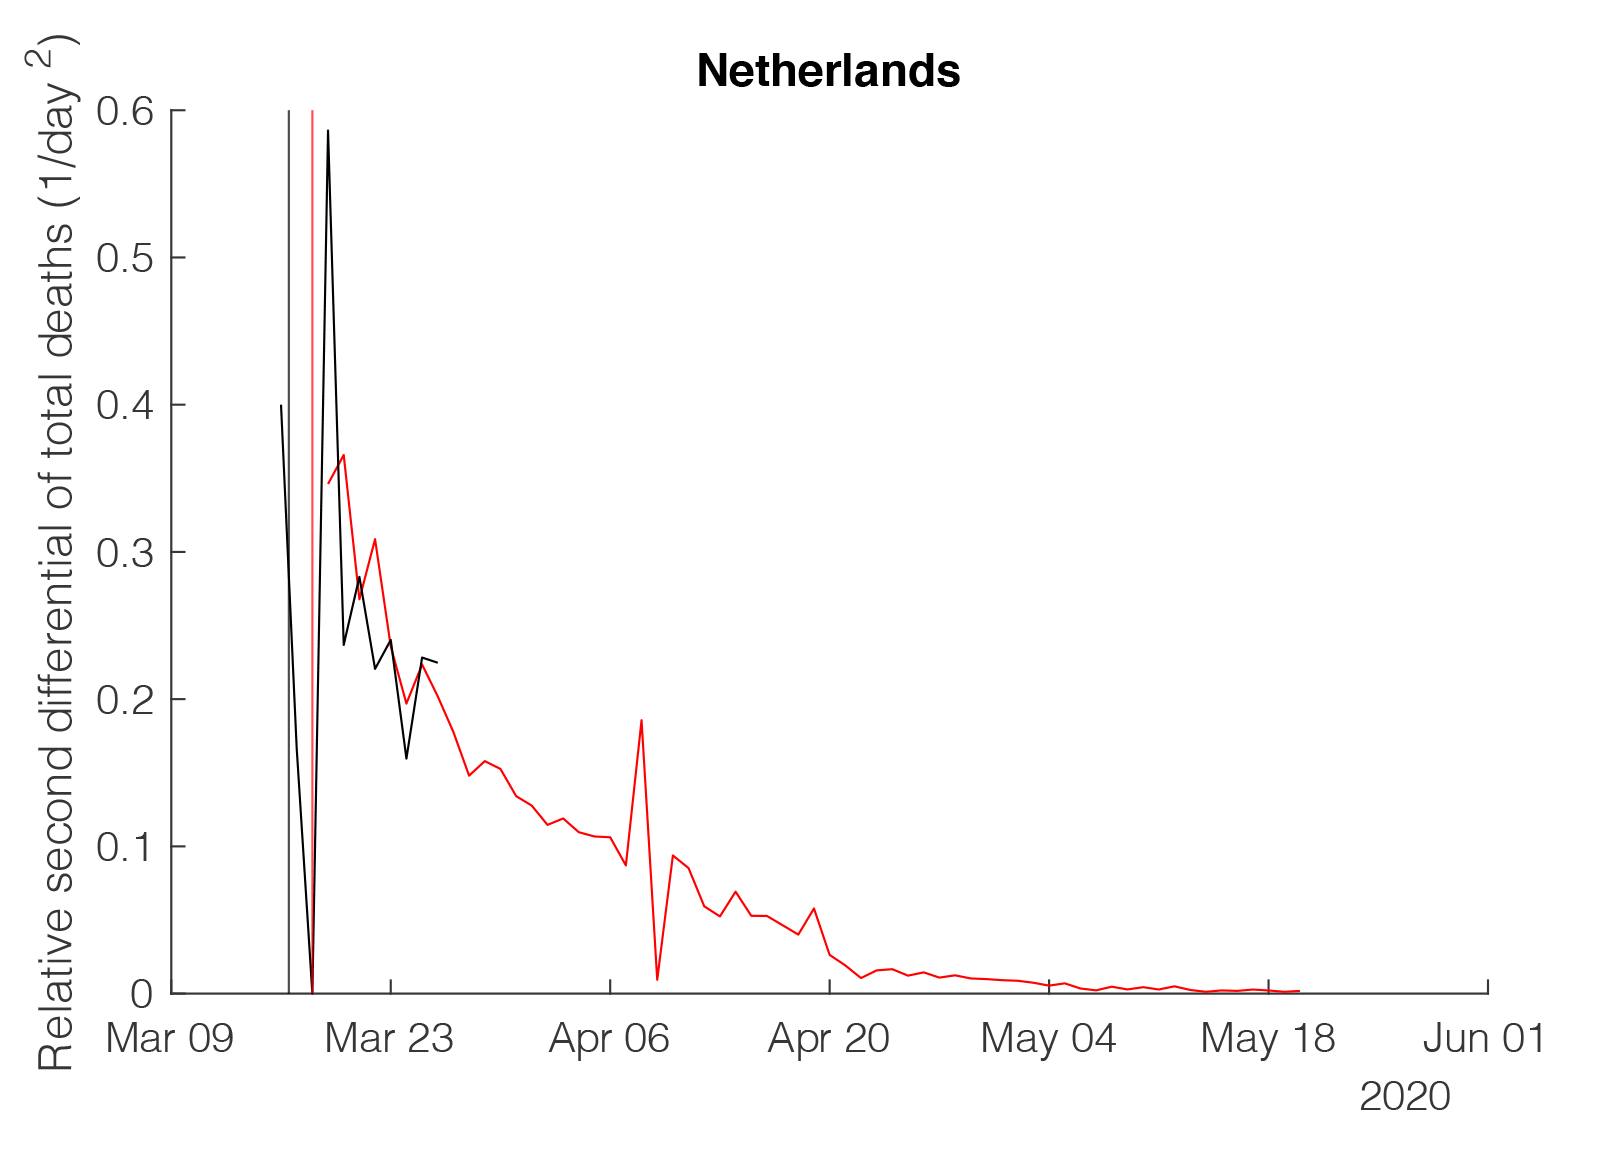
Netherlands
390
Peak Deaths per Day
April 9
Date of Peak Deaths
8,400
Total Deaths
Spain
2,000
Peak Deaths per Day
April 6
Date of Peak Deaths
44,000
Total Deaths
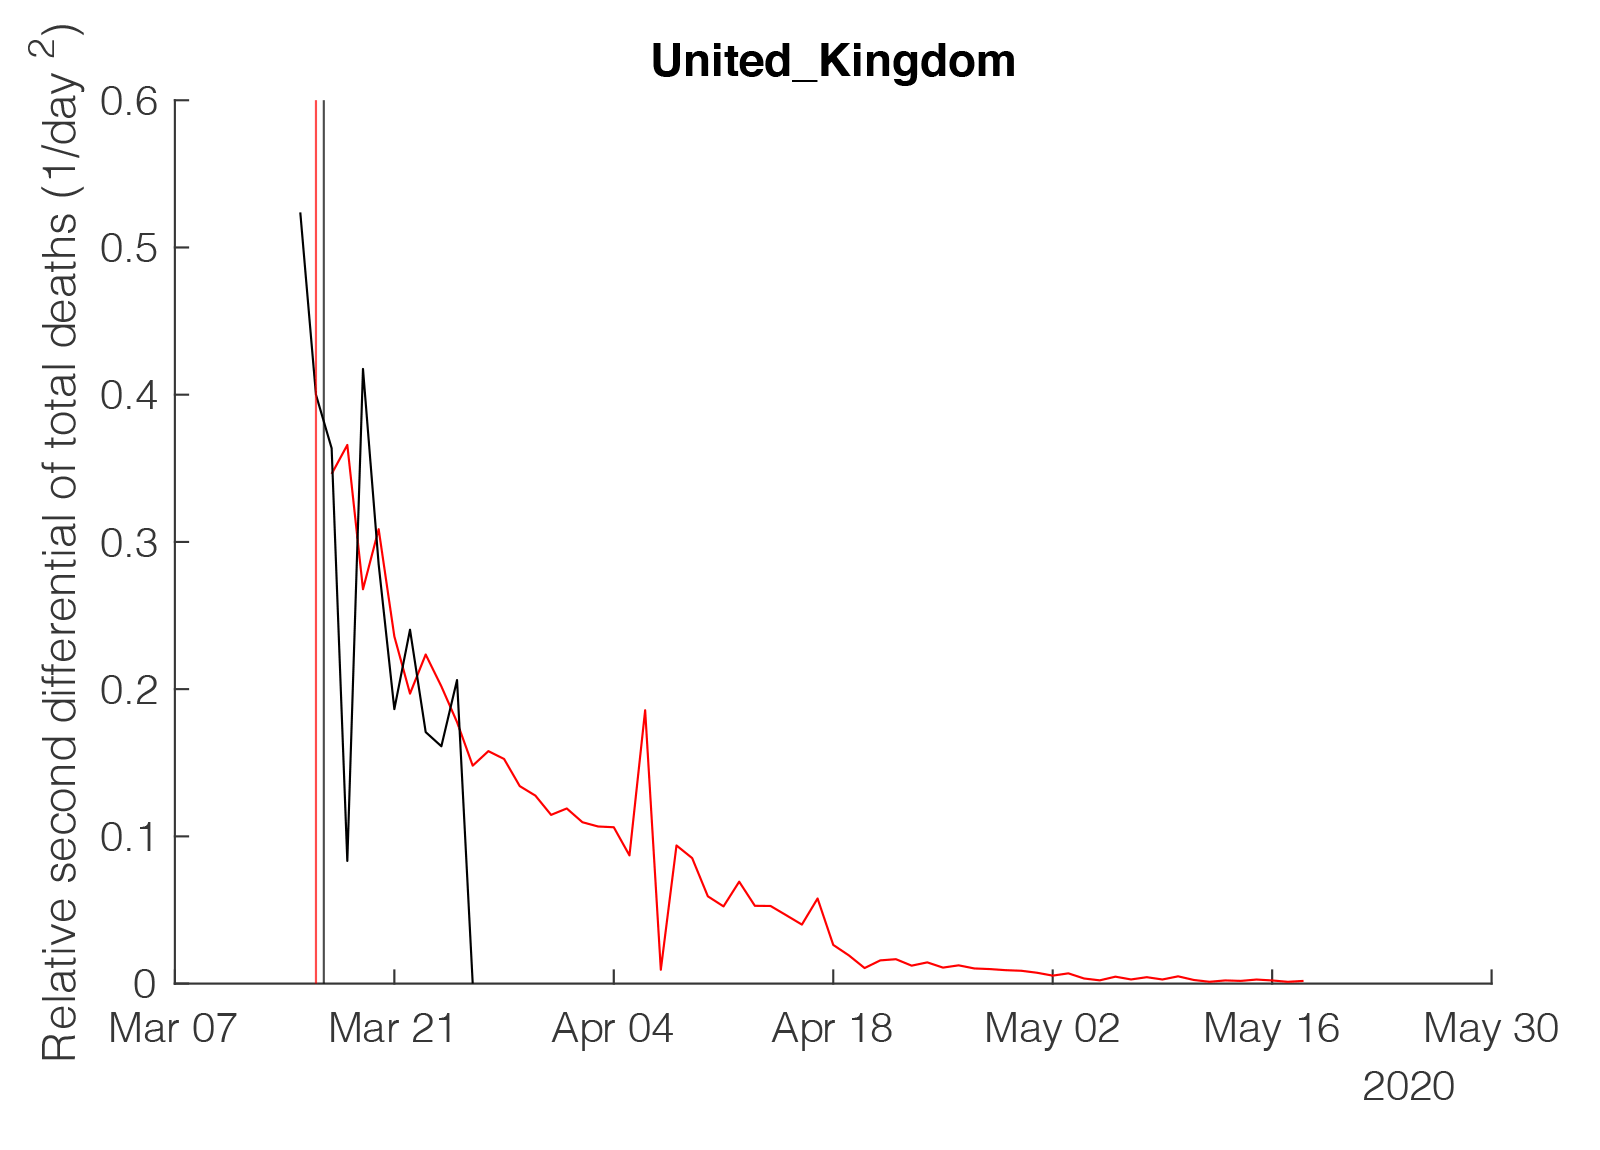
United Kingdom
1100
Peak Deaths per Day
April 12
Date of Peak Deaths
24,000
Total Deaths
Grouped
Total Deaths

Daily Deaths